


The FARMAX HeatMap SystemHere is a screen shot of temperature conditions in a poultry building with 20 inside temperature sensors, 1 inside relative humidity and ammonia sensor and 1 outside temperature and relative humidity sensor. It is -3.3 C [26 F] on the southwest corner of the building and -7.9 C [18 F] on the northeast corner of the building. The average inside temperature is 24.0 C [75 F]. The fans in operation are shown with small arrows at their position in the building. 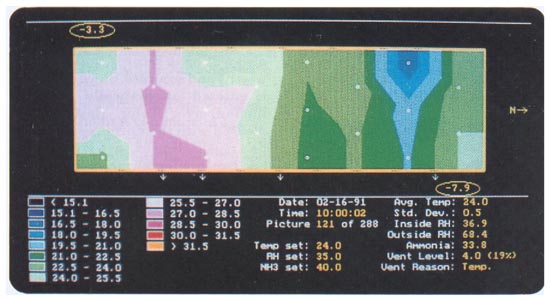
It is 10:00 AM on Feb 16, 1991. Suddenly, the electrical power goes off. The owner/manager is in town and the substitute worker does not know how to hook up the standby generator. What happens? 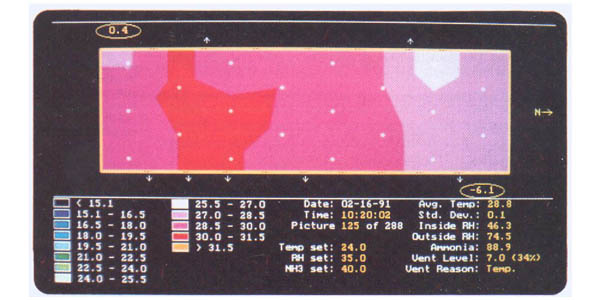
Temperatures climbed dramatically so that by 10:20, temperatures had reached between 30 [86 F] and 31.5 degrees C in a third of the barn. 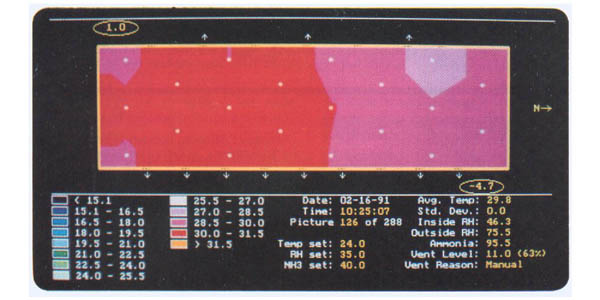
By 10:25 over half the barn had risen above 30 C [86 F] with the overall average temperature at 29.8 C. Then the owner arrived home and the generator was started. All the fans were turned on. 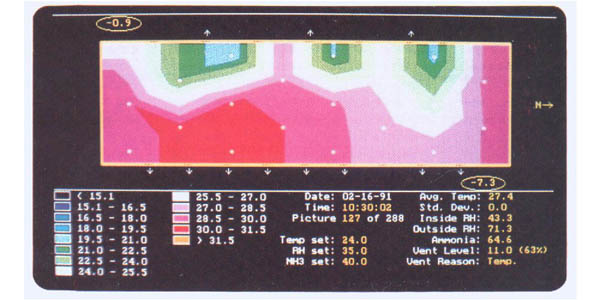
Within minutes, cool air began flowing into the barn and by 10:30 the average temperature had been reduced to 27.4 C [81 F]. You can see where the cool air has entered the barn from the west side [top] of the picture. 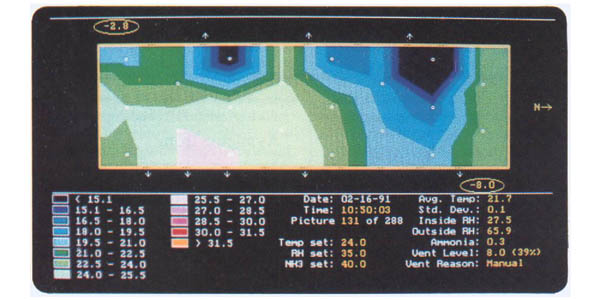
By 10:50 the barn temperature has been reduced to 21.7 C [71 F]. But, unfortunately the damage had been done. The FARMAX HeatMap System will display color-contour maps dynamically, like watching a movie. It is a tool that allows managers to determine how well the building is performing with respect to maintaining desired temperatures and uniformity of conditions. The HeatMap System is available as a stand-alone application that can process ASCII files of temperature or other date. Please contact Shand & Company at 1-800-890-8608 for more information. |